Meta Ads Breakdowns Explained: Stop Wasting Ad Spend
Meta Ads Breakdowns Explained: Stop Wasting Ad Spend
If you're running Meta ads but never look at your breakdowns, you're missing the exact information that tells you what's actually working in your account. This is one thing I check on every single campaign I run, whether it's my own account or a student's account inside Meta Ads Systems.
Watch the full walkthrough here:https://www.youtube.com/watch?v=ptZZj9ddETs
Why Your Meta Ads Dashboard Isn't Enough
Open your Meta dashboard and you'll see the basics: total CTR, cost per click, leads, cost per acquisition, CPM. All useful numbers, but all surface level. If you're targeting multiple countries, that overall CTR doesn't tell you which country is actually your best performer. Your CTR could look great on paper, but only because a placement like Audience Network is inflating it with junk clicks you don't even want.
That's exactly what the breakdown feature solves. It shows you where your numbers are actually coming from, not just what the total says.
Where to Find Breakdowns in Meta Ads Manager
Inside Ads Manager, open any campaign, ad set, or ad, and look for the "Breakdown" dropdown above your results table. From there you can split your data by delivery (age, gender, region, country, placement, platform), by action (device, destination, conversion device), or by time (day, week, month). You can also combine multiple breakdowns at once, which is where the real insight shows up.
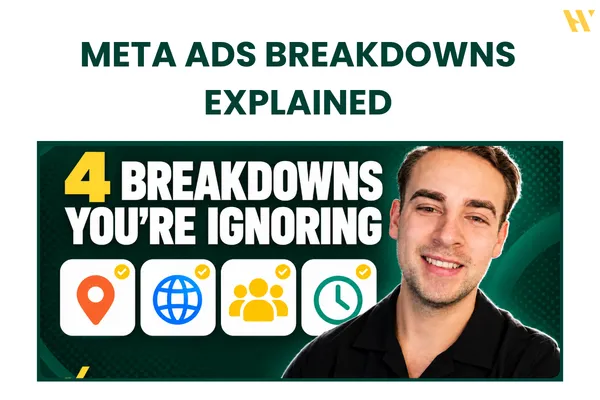
The 4 Breakdowns I Use in Every Account
I mainly rely on four breakdowns for almost every account I manage.
1. Placement and platform. Inside the platform breakdown, it matters which specific placement is doing the work. If Instagram is your best platform, is it the feed or Stories carrying the results, or should you be leaning into Reels? You won't know until you check.
2. Country. If you're running to a tier one audience or worldwide targeting, you need to know your actual best countries. Maybe it's the US and UK carrying your results. That's critical for a scanning campaign or an audience testing campaign, and it tells you exactly where to double down and where to cut spend that's going nowhere.
3. Age and gender. This one builds your real ideal customer profile. If most of your purchases are coming from 40 to 50 year old guys, that's how you need to shape your creatives and your messaging going forward, not based on who you assumed would buy.
4. Time of day. This is where day parting comes in. Your time breakdown shows your best days and hours, so you can avoid running ads during weak, inactive hours and save real money. It's a simple strategy, and almost nobody sets it up.
The Audience Network Trap
Here's a mistake I see constantly. If you're using Advantage+ placements, Audience Network gets included automatically. Audience Network is basically Meta's partner apps, not Facebook or Instagram itself, often mobile games.
You know the scenario. You're playing a game, a random ad pops up, you try to close it and end up clicking by accident. A lot of this "engagement" comes from exactly that. So if your clickthrough rate suddenly looks amazing, somewhere around 7 to 10%, that's your cue to check the placement breakdown before you celebrate. It's often Audience Network quietly inflating your numbers with clicks that never turn into anything.
A Real Example From My Own Ad Account
I ran a campaign promoting my Skool community with worldwide targeting and pulled 13 purchases. Here's exactly what the breakdowns showed me.
Country breakdown: Because it was worldwide targeting, purchases came in from several different countries. I could compare clickthrough rate, CPC, and CPM side by side for each one. The US, for example, showed a 10% CTR but only two clicks, a tiny sample that would've been easy to misread without seeing the full picture.
Placement breakdown: Audience Network had the highest CTR and the lowest cost per click on paper. It looked like my best performer. In reality, it was cheap, unqualified traffic that inflated the data and did nothing for the business. After the first dollar spent, I caught it and paused that placement, only $2 wasted. The rest of the budget split between Instagram and Facebook, and Instagram clearly outperformed. Lower cost per result, nine purchases compared to three on Facebook, and my cost per purchase on Facebook was more than double.
Age breakdown: Five purchases came from 18 to 24 year olds, four from 25 to 34. A clearly younger audience buying, which changes how I think about future creative and messaging.
Day breakdown: A few specific days carried most of my results, while other days brought in just one purchase or none at all. That's exactly the pattern day parting is built to take advantage of.
There are more breakdowns worth exploring too. The creative breakdown, for example, shows related media, useful if you accidentally reuse an asset and want to see what else converted alongside it.
What to Actually Do With What You Find
Reading a breakdown is only half the job. Once you see the data, act on it:
If a placement is inflating your CTR with junk clicks, exclude it and rerun the numbers.
If one or two countries are carrying all your purchases, shift more budget there and consider cutting the ones burning spend with zero conversions.
If your buyers skew heavily toward one age group or gender, rebuild your creative and copy around that audience instead of a broader assumption.
If certain days or hours consistently underperform, set up day parting so your budget isn't running during dead hours.
None of this takes long once it's a habit. It just has to become part of how you check your account, not an occasional deep dive.
Why This Matters Even If You Use AI to Manage Your Ads
If you've got ChatGPT or Claude connected to your ad account through an MCP, it might tell you your top five ads have a 5% clickthrough rate and stop there. Without pulling the breakdown, the AI won't catch that those numbers are inflated by the wrong placement. The data your dashboard shows and the data your breakdown shows are two different stories, and only one of them tells you the truth.
This is a big part of what I cover inside AI Meta Ads Analysis, where I show the exact prompts and workflows I use to get AI tools to actually read breakdown data instead of just repeating the surface metrics. If you want to see how I set this up with ChatGPT and the Meta Ads MCP, I also broke that down in this post.
The Bottom Line
All this breakdown data is genuinely useful, but reading it manually every single time is slow and easy to get wrong. That's part of why I'm working on a way to automate it, more on that soon. For now, the habit alone (checking placement, country, age and gender, and time before you scale or kill anything) will save you money almost immediately, and it will make every future optimization decision more accurate.
Watch the Full Walkthrough
I go through all of this live inside a real ad account in the video, numbers and all:
https://www.youtube.com/watch?v=ptZZj9ddETs
Want more strategies like this?
If you want the deeper prompts, workflows, and systems I use to run and analyze my own Meta ads, join Meta Ads Systems, the Skool community by Wupscale. Inside, you'll also find Meta Ads Training and more breakdowns like this one in the Meta Ads Tutorials library. There's a 7-day free trial.
👉 Join here: https://www.skool.com/advertising