Meta Ads KPIs 2026: Benchmarks, CTR, CPC & Custom Metrics
Meta Ads KPIs 2026: Benchmarks, CTR, CPC & Custom Metrics
If you're running Meta Ads, you probably spend a lot of time looking at numbers like CTR, CPC, CPM, and ROAS.
But what are actually good numbers in 2026?
I've made a few versions of this video over the past couple of years because the benchmarks I use keep changing.
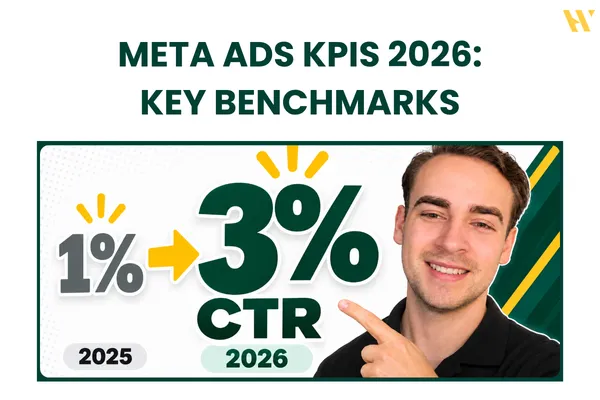
Back in 2025, I was aiming for around 1% CTR on my Meta Ads campaigns.
Now I'm targeting at least 2 to 3%.
I've also noticed CPC and CPM increasing in some of the accounts and markets I work with, which means I'm paying closer attention to what happens after someone clicks an ad.
If traffic is getting more expensive, your landing page, product page, and checkout funnel need to convert that traffic properly.
So in this guide, I'll break down the main Meta Ads KPIs I track in 2026, the benchmarks I'm currently using, what each metric means, and how you can create custom metrics inside Meta Ads Manager.
These are my working targets based on what I'm seeing, not official benchmarks that every advertising account needs to hit.
Your numbers will depend on your target country, industry, offer, margins, and campaign objective.
If you'd rather watch the full walkthrough, here's the video:
Watch: Meta Ads KPIs Explained (2026 Benchmarks + Custom Metrics)
My Updated Meta Ads KPI Benchmarks for 2026
Let's start with the numbers.
Here are the main benchmarks I'm currently using when reviewing my Meta Ads campaigns.
Metric | My 2026 Target |
|---|---|
Link CTR | 2 to 3% |
CPC (Link Click) | $1 to $1.50 |
CPM | $20 to $55 |
ROAS | 2 to 3x as a reference |
Add-to-Cart / Link Clicks | Around 15% |
Purchases / Add-to-Carts | 40 to 50% |
Video Hook Rate | Around 25% |
Video Hold Rate | Around 25% |
These numbers aren't universal.
For example, a campaign targeting the United States will usually have different advertising costs compared with one targeting a worldwide audience.
The same applies to ecommerce versus lead generation.
And ROAS depends heavily on your margins and break-even numbers.
What matters is understanding what each KPI tells you, so you know what to improve when something isn't working.
1. CPC: Cost Per Click
Let's start with CPC.
CPC stands for Cost Per Click.
It tells you how much you're paying for someone to click your ad.
But there's an important distinction here.
You need to understand the difference between CPC (All) and CPC (Link Click).
CPC (All) vs CPC (Link Click)
When someone interacts with your Facebook or Instagram ad, there are several actions Meta can count as clicks.
For example:
Clicking See More to read the rest of your ad copy
Clicking an image
Clicking other interactive elements
Clicking a link or call-to-action destination
These interactions don't all mean someone visited your website.
That's why I prefer tracking CPC based on link clicks when I'm running campaigns that send people to a landing page.
Let's say your CPC (All) is $0.20.
That might look great.
But what if most people are just expanding your ad copy and never clicking through to your website?
Now the metric doesn't tell you much about how efficiently you're generating website traffic.
For my campaigns, I'm currently targeting around $1 to $1.50 CPC (Link Click).
That's higher than the approximately $1 target I used previously.
But again, the number itself isn't everything.
If you're paying $1.50 per link click but those visitors are converting profitably, I wouldn't automatically consider that bad.
What Affects Your CPC?
I normally start by looking at the messaging.
Especially:
Primary text
Headline
Offer
Call to action
How clearly the ad explains the benefit
If people are interested enough to interact with the creative but aren't clicking the link, the message might not be convincing them to take the next step.
Of course, your audience, competition, placement, and auction conditions also affect CPC.
But ad copy and the offer are useful places to start testing.
2. CTR: Click-Through Rate
Next is CTR.
CTR measures the percentage of impressions that generate clicks.
And this is one of the metrics where I've adjusted my expectations.
Back in 2025, I was aiming for around 1%.
Now I'm generally targeting 2 to 3% link CTR.
I'm also seeing campaigns reach 3 to 4%, so those numbers aren't necessarily unusual in the accounts I'm reviewing.
That doesn't mean every campaign needs to hit 3%.
But it gives me a reference point when evaluating creative performance.
CTR (All) vs CTR (Link)
Just like CPC, Meta reports different CTR metrics.
CTR (All) includes a broader range of interactions.
CTR (Link Click-Through Rate) measures link clicks relative to impressions.
For most of my landing page campaigns, I focus on link CTR.
Here's why.
Imagine you have an ad with a high CTR (All), but a much lower CTR (Link).
People might be clicking to expand the text, view the creative, or interact with the ad.
But they're not taking the action you actually want.
That's worth investigating.
One possibility is that the creative is getting attention, but the ad copy or offer isn't convincing people to click through.
In that situation, I might test different primary texts or headlines before completely replacing the creative.
A difference between those two CTR metrics isn't proof that the copy is weak, but it's a useful clue.
What Affects CTR?
The biggest factors I look at are:
Your creative
Your offer
The first few seconds of your video
The messaging
How relevant the ad is to your audience
Let's say you're running a Black Friday promotion with 40% or 50% off.
You might see a much higher CTR because the offer is stronger.
But if you're running a regular campaign without a discount, you shouldn't automatically expect the same result.
Compare your metrics in the context of the campaign.
If you're interested in how I organize creative testing, I've also covered my full Meta Ads campaign structure for 2026.
3. CPM: Cost Per 1,000 Impressions
CPM is the cost of getting 1,000 ad impressions.
It's one of the easiest metrics to misunderstand.
A lot of advertisers see their CPM increasing and assume something is wrong.
But a high CPM isn't necessarily bad.
Previously, I was commonly looking at around $20 to $25.
Now I'm using a wider reference range of approximately $20 to $55 in the markets I discuss in the video.
And the country you're targeting makes a big difference.
If you're advertising in the United States, your CPM can be much higher than when you're targeting a broader worldwide audience.
Competition, seasonality, placements, and audience conditions all influence the number.
Can You Be Profitable With a $70 or $100 CPM?
Yes, it's possible.
Let's say you're running an ad with a $70 CPM.
That sounds expensive.
But what if the creative is generating a 5% link CTR?
You're getting more clicks from those impressions.
And if those visitors are converting into paying customers at a profitable CPA, a high CPM by itself isn't necessarily a problem.
This is why I don't recommend optimizing campaigns around CPM alone.
You need to look at the full picture.
A low CPM with terrible traffic quality isn't automatically better than a higher CPM with customers who convert.
4. Reach, Impressions, and Frequency
These three metrics are connected.
Reach is the number of unique people who saw your ad.
Impressions is the total number of times your ad was shown.
Frequency tells you how many times, on average, each reached person saw the ad.
The formula is:
Frequency = Impressions / Reach
For example, if your ad has 10,000 impressions and reaches 5,000 people, the average frequency is 2.
I discuss a frequency reference of around 5 to 10 in the video, but you need to consider the reporting period and the audience before using that range.
A frequency of 5 over a short period is different from a frequency of 5 across several months.
It's also different for prospecting and retargeting campaigns.
Prospecting audiences generally need a different approach from people who already know your business.
The main thing I watch for is ad fatigue.
If frequency keeps increasing while CTR drops and CPA increases, that's a reason to investigate whether the creative is losing momentum.
But I wouldn't pause an otherwise profitable ad just because frequency reaches an arbitrary number.
5. Link Clicks vs Landing Page Views
This is one of the most useful comparisons when you're analyzing Meta Ads.
A link click doesn't necessarily mean someone successfully loaded your landing page.
That's why I like tracking both link clicks and landing page views.
Let's say your ad generates 100 link clicks.
But your account only reports 50 landing page views.
That means there's a substantial difference between the two reported numbers.
People are clicking your ad, but those clicks aren't translating into the same number of tracked page views.
Why Does This Happen?
There are several possible reasons:
Your website is loading too slowly
People leave before the page finishes loading
Your tracking isn't configured correctly
Browser or privacy restrictions affect measurement
Visitors are having issues opening the page
In my campaigns, I use custom metrics to make this comparison easier.
For example:
Landing Page View Rate = Landing Page Views / Link Clicks
If the percentage is unusually low, I investigate.
Maybe the landing page is taking too long to load.
Maybe the tracking needs attention.
Or maybe people aren't reaching the destination successfully.
The important thing is not to assume all your paid clicks are turning into actual website visits.
Before scaling an ad, check that the traffic is reaching the landing page and that your tracking is working properly.
Otherwise, you could spend more money without understanding where the traffic is disappearing.
6. ROAS: Return on Ad Spend
Now let's talk about everyone's favorite ecommerce metric.
ROAS.
ROAS stands for Return on Ad Spend.
The formula is simple:
ROAS = Attributed Revenue / Ad Spend
If you spend $1,000 on ads and generate $3,000 in attributed revenue, your reported ROAS is 3x.
In the video, I use 2 to 3x ROAS as a broad reference.
But I want to make something clear.
A 3x ROAS isn't automatically profitable for every business.
And a 2x ROAS isn't automatically bad.
You need to know your break-even numbers.
Why Break-Even ROAS Matters
To calculate your break-even ROAS properly, you need to understand your costs.
That includes things like:
Product costs
Shipping and fulfillment
Payment processing fees
Taxes and other relevant charges
Other variable costs associated with an order
Once you know how much contribution margin you have available before advertising costs, you can calculate how much you're able to spend on customer acquisition.
That's much more useful than copying a general ROAS benchmark from another advertiser.
Your break-even CPA is also important.
If your CPA is above what your margins can support, the campaign might not be profitable even when your CTR looks excellent.
And remember, ROAS in Ads Manager is based on attributed revenue. It isn't the same thing as your final business profit.
ROAS Is the Result of Your Whole Funnel
Your CPM, CTR, CPC, landing page performance, product page, and checkout funnel all contribute to the final result.
That's why I don't like optimizing only for ROAS without understanding what happens earlier in the customer journey.
If ROAS starts dropping, I want to know why.
Are clicks becoming more expensive?
Are fewer people reaching the landing page?
Are visitors adding products to their carts but not purchasing?
Each situation needs a different solution.
7. Ecommerce KPI: Add-to-Cart-to-Link-Click Ratio
Now let's get into two custom metrics I like tracking for ecommerce.
The first is the Add-to-Cart-to-Link-Click Ratio.
It measures the number of add-to-cart events relative to link clicks.
The formula is:
Add-to-Cart-to-Link-Click Ratio = Add-to-Carts / Link Clicks × 100
My working benchmark is around 15%.
I use this as a signal of how well the traffic and product page are working together.
If the number is much lower than expected, I would start investigating the product page.
How to Improve a Low Add-to-Cart Ratio
Some things I'd check:
Product images
Are the images high quality?
Do they show the product clearly?
Can customers understand what they're buying?
Product descriptions
Are you explaining the benefits properly?
Is the important information easy to find?
Reviews and social proof
Do customers have enough information to trust the product and the business?
Pricing
Is the price competitive with similar offers?
Does the value make sense?
Traffic quality
Are you sending the right people to the product page?
These are all worth reviewing.
But the ratio alone doesn't prove that your product page is the problem.
Tracking quality and the traffic source can affect the metric too.
The useful part is knowing where to start investigating.
8. Ecommerce KPI: Purchase-to-Add-to-Cart Ratio
The second ecommerce metric measures your checkout funnel.
Once someone adds a product to their cart, how many of those add-to-cart events turn into purchases?
The formula is:
Purchase-to-Add-to-Cart Ratio = Purchases / Add-to-Carts × 100
In the video, I explain that I've raised my lower target from around 30% to 40%.
Now I'm aiming for 40 to 50%.
Why?
Because when acquiring traffic becomes more expensive, I want to make better use of the visitors who already showed purchase intent.
If someone adds a product to their cart, they've already taken an important step.
I don't want to lose them because the checkout process is complicated.
What If the Ratio Is Below 30%?
That's a signal I'd investigate.
Some possible issues include:
Checkout pages loading slowly
Too many form fields
Unexpected shipping charges
Complicated payment options
Too many upsells
Unclear refund or delivery information
A lack of trust during checkout
This is where conversion rate optimization, or CRO, becomes important.
But make sure you're measuring the funnel correctly before diagnosing it. Add-to-cart events and purchases aren't always a clean one-to-one user journey, particularly when people add multiple products or return later.
The goal is to understand where your customers are dropping off and improve that part of the process.
9. Video Ads: Hook Rate and Hold Rate
If you're running video ads, there are two custom metrics I like using.
Hook Rate and Hold Rate.
They help you evaluate different parts of the creative.
Hook Rate
Hook Rate measures how often your video gets viewers through the first few seconds.
In my reporting setup, I calculate it as:
Hook Rate = 3-Second Video Plays / Impressions × 100
My reference target is approximately 25%.
If your Hook Rate is low, I would start by reviewing the opening three seconds.
Maybe the video takes too long to explain the offer.
Maybe the first visual isn't interesting.
Or maybe the opening message doesn't connect with the target audience.
This is where I'd test different hooks.
Sometimes you don't need to remake the entire video. You might just need a better opening.
Hold Rate
Hold Rate measures how effectively the video keeps people watching after the initial hook.
In my setup, I use:
Hold Rate = ThruPlays / 3-Second Video Plays × 100
My working benchmark is also around 25%.
Meta's ThruPlay metric typically counts videos watched to completion when they're shorter than 15 seconds, or at least 15 seconds for longer videos.
That's worth keeping in mind when comparing videos of different lengths.
If your Hook Rate is good but Hold Rate is weak, the opening might be working, but the rest of the creative isn't keeping viewers interested.
In that situation, I'd review:
The pacing
How the product is explained
The main message
The sequence of visuals
Whether the video takes too long to get to the point
Hook Rate and Hold Rate are diagnostic metrics.
Ultimately, the video still needs to produce the conversion results you're paying for.
10. How to Create Custom Metrics in Meta Ads Manager
Now let's get into the practical setup.
One thing I show in the video is how I organize my reporting columns and create custom metrics inside Meta Ads Manager.
I use these custom metrics because they make it easier to understand what needs improvement.
Instead of manually calculating ratios every time I review a campaign, I can see them directly in the reporting dashboard.
Step 1: Open Customize Columns
Inside Meta Ads Manager, open the Columns dropdown.
Select Customize Columns.
This is where you can select, remove, and reorder your reporting metrics.
Step 2: Create a Custom Metric
Find the Custom Metrics section and select the option to create a new metric.
In the video, I create an example called Hook Rate Test because I already have the original Hook Rate configured in my account.
Step 3: Enter the Formula
For Hook Rate, select 3-Second Video Plays and divide that metric by Impressions.
Choose Percentage as the display format.
Give the metric a clear name so you can identify it later.
Step 4: Set the Access
I normally set access to everyone who has access to the business, where that option is available.
Why?
Because if you're working with a media buying team or you hire someone later, you don't want everyone having to recreate the same custom metrics.
It's much easier when the reporting setup is consistent across the team.
Step 5: Add the Metric to Your Columns
After creating the metric, find it under the appropriate custom metrics access section.
Add it to your reporting columns.
You can then drag it into the position you want.
For example, I like grouping my creative metrics together.
I'll normally have CTR, CPC, Hook Rate, and Hold Rate close to each other.
That way, I can review creative performance without jumping between unrelated columns.
Step 6: Save Your Column Preset
Once everything is organized, save the columns as a preset.
This is especially useful if you manage several ad accounts.
You can build reporting views for different campaign types, including ecommerce, lead generation, or community growth.
You don't need every possible metric in every report.
You need the numbers that help you make decisions.
If you're also organizing your testing and scaling campaigns, check out my Meta Ads campaign structure guide.
And if you want to compare these updated targets with the framework I previously shared, I've also written an earlier Meta Ads KPI tracking guide.
11. Which Meta Ads KPI Should You Fix First?
Here's how I think about it when reviewing a campaign.
If link CTR is low, start by checking the creative, hook, and offer.
If CPC is high, review the message, headline, call to action, and traffic competition.
If CPM is high, look at your target market and auction conditions before assuming the campaign is broken.
If link clicks are much higher than landing page views, investigate page speed and tracking.
If the add-to-cart ratio is low, look at the product page, pricing, traffic quality, and offer.
If the purchase-to-add-to-cart ratio is low, review your checkout experience.
If Hook Rate is low, fix the first three seconds of the video.
If Hold Rate is low, look at what happens after the opening.
And if ROAS is below your break-even level, don't just stare at the ROAS number.
Work backward through the funnel and find the actual issue.
That's the whole point of tracking these KPIs.
You're not collecting numbers just to have a nice-looking dashboard.
You're using them to decide what to test and improve.
Final Thoughts: Don't Judge Your Meta Ads by One Metric
Meta Ads benchmarks change.
Your CPM might go up.
Your CPC might increase.
And the CTR you're happy with today might be different from what you were targeting last year.
That's why I keep updating the benchmarks I use.
But the main thing hasn't changed.
You need to understand what each metric means and what affects it.
Don't pause an ad just because CPM is high.
Don't assume your campaign is doing well because CTR (All) looks great.
And don't scale a campaign before checking whether your tracking and conversion funnel are working.
Look at the whole picture.
Your creative gets attention.
Your messaging earns the click.
Your landing page needs to load properly.
Your product page needs to convince people.
And your checkout needs to convert.
That's how the numbers connect.
If you want to see my full KPI breakdown and follow along as I create custom metrics inside Meta Ads Manager, watch the video here:
Watch the full Meta Ads KPI tutorial:
Want More Practical Meta Ads Strategies?
If you're running Facebook or Instagram ads and want to improve how you test, analyze, and scale campaigns, check out Meta Ads Systems by Wupscale.
Inside the community, I share practical Meta Ads tutorials, creative testing workflows, campaign optimization strategies, and AI tools for media buyers.
Join Meta Ads Systems on Skool:
https://www.skool.com/advertising
I'll see you inside!
Máté